Which items have the highest profit margin on my menu(s)?
Let Apicbase help you to determine which items have the best profit margin on your menu. In no time you'll know which items make money and which items don't.
If you want to know for a specific recipe if the profit margin is on point, or you want to compare the theoretical profit margin with the real profit margin. Read all about it in this article.
However, if you want to compare the theoretical margin of a group of ingredients with each other, look below.
- To compare the profit margin of a set of recipes, you will first have to create a menu containing the recipes you want to compare. Read this article to learn how this works. This can be, for example, a menu of all your main courses, all your cocktails, all the options customers can choose in a 3 course menu etc.
- Once you have created the menu, open it by clicking on "Products" and selecting "Menus".
- Open the menu you want to compare by clicking the menu name and go to the "Recipe comparison" tab.
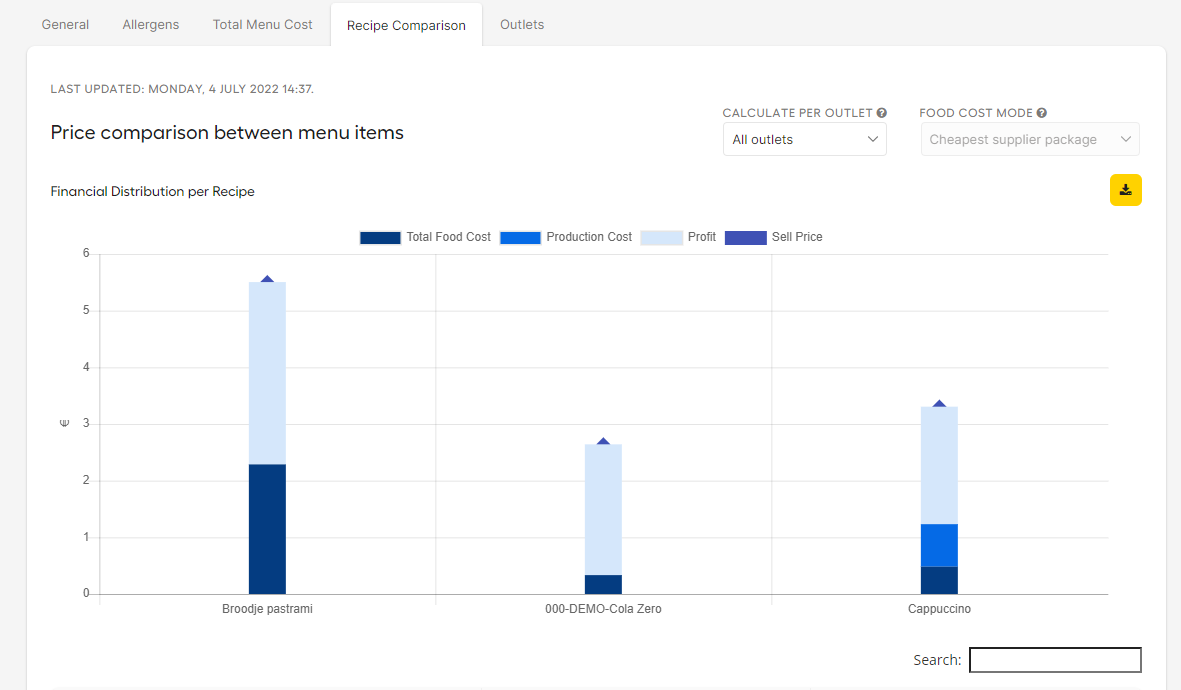
- First of all, you get a graph, where you can see the theoretical sell price (purple diamond), the profit (Light Blue), production cost (Marine Blue), and total food cost (Dark Blue).
- Because Menu's are situated on the liberary level, you can also calculate the profit margins for specific outlets in case they work with different suppliers or you can select the right "Food Cost Mode". This setting defines how we disambiguates between ingredients with multiple suppliers.

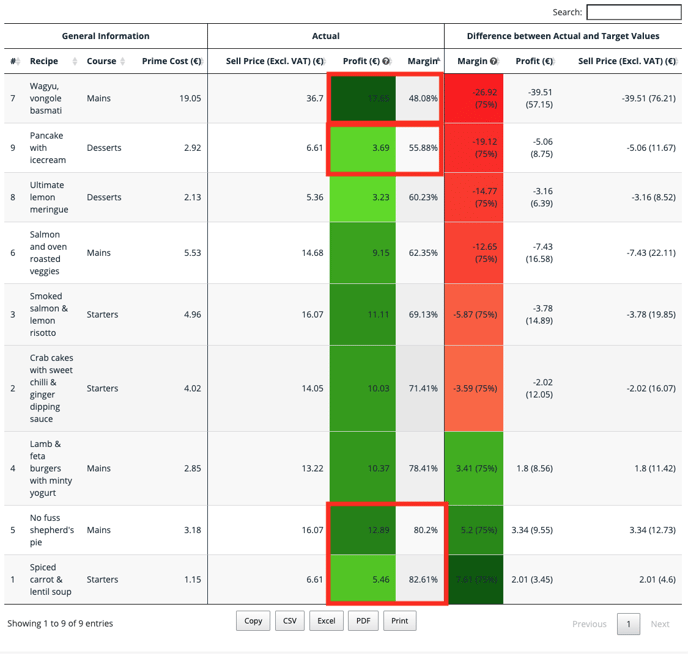
- When you see the table beneath the graph, you get even more detail. The Wagyu and pancakes have the lowest profit margin, but the Wagyu has a big profit in nominal terms. The No-fuss shepherd's pie and the spiced carrot soup have a big profit percentage. (Different Example)
