What you need to know about Count Report and Variance Report
After we save the count details, we sometimes want to make sure that the data in our system and in the excel reports are coherent and understandable. As there are instances when we download the count report and variance report, and we find that the numbers do not match, we worry and think that there are discrepancies or wrong data displayed in the system or in the reports. However, this is not always the case. Read more about the data displayed in your count and variance reports in the succeeding parts of this article.
Count Report
In the system, one count can actually include other sub-counts.
- For example: You counted 85 items for this count but the count total is 165, this means that there could be 80 items in some other sub-count.
In your downloaded count report, the report shows only the number of units of the package that you counted but this does not necessarily represent the total amount of units that this article has in storage. At the same time, the count report shows individually how many units of each package was counted. When you are doing a count, the count page warns you if you have units for both a base package and a top package in your inventory but you only count one of them. This is because the units in your inventory will add the quantity of items in the top package you counted and the quantity of items in the base package, in which the sum will be displayed in the downloaded count report.
Variance Report
The term ‘variance’ is used to describe the difference between the theoretical stock in Apicbase and your actual stock. The purpose of checking variance is to determine if your stock per item is in order.
- For example, if your variance is negative because you have less actual stock than theoretical stock, this could mean that you have missing stock.
After the count, the displayed variance in the system is according to the item.
- For example, your theoretical stock is 15 and you counted 13 as your actual stock, then your variance is -2. Please note that since you can count items per package, you can check their variance per package as well. For example, you have an item Coriander in 30g and 2g in packs. When you check the details of your count, you will see that the actual count you made for both 30g and 2g also reflects their variance, but the base package is always at the top followed by the other packages.
However, in the downloaded variance report, this is not the case. Apicbase aggregates the counted quantity and the data displayed in the excel file is a combined total resulting variance of the base package and the counted top package of the item. For example, the variance for Coriander 30g is 3 and the variance for Coriander 2g is 2. In the excel file, you will only see Coriander 30g with a variance of 5 because the variance of the two packages were added together in this report. This might seem complicated at first but the purpose of the report is to give you an overview of the reflecting variance per item after the count event.
In order to have useable variance data, we advise doing a monthly stock count for every outlet on the last day of the month. If you want to do read up on counting your inventory, please check this article.
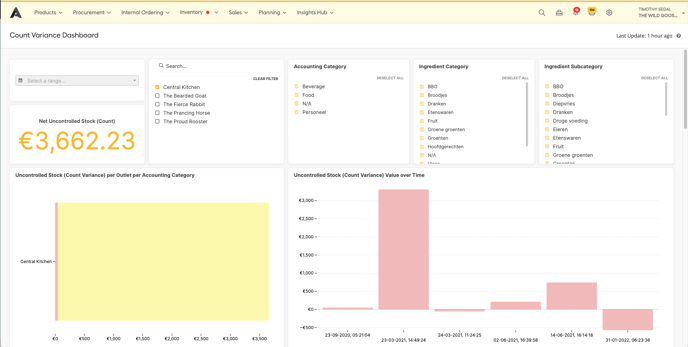
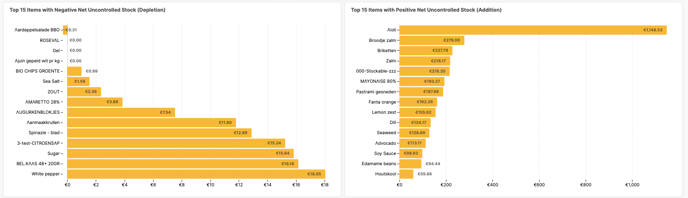
Uncontrolled Stock or Count Variance is the difference between the theoretical stock in Apicbase and the actual stock you have counted. So if you have more actual stock than theoretical stock, you have positive net uncontrolled stock. If you have less actual stock than theoretical stock, you have negative net uncontrolled stock.
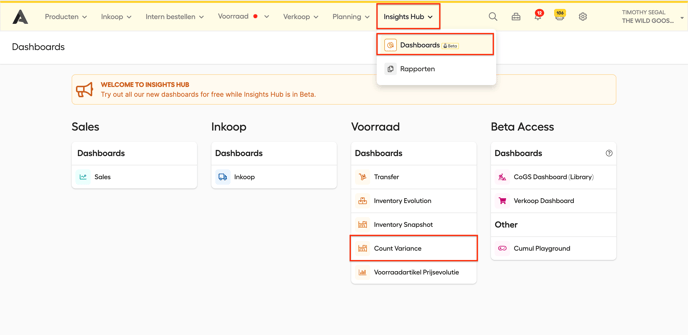
As with all our dashboards, this dashboard can be found in our "Insights Hub". Click on "Insights Hub" and select "Count Variance".
- First set the right filters to get the right data.
- Select a date range.
- Select the right outlet(s).
- Select the right categories of products for which you want to see the data.
- Accounting Category.
- Ingredient Category.
- Ingredient Subcategory.
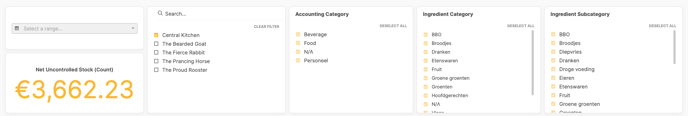
- After setting the filters you get the following data:
- Net Uncontrolled Stock (Count): This is the sum of all variances during the selected period.
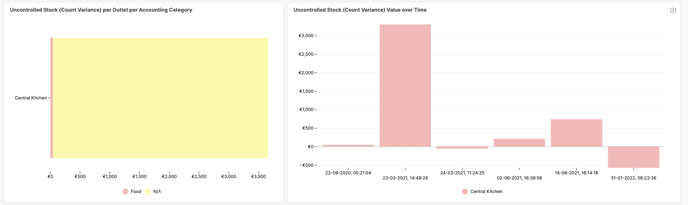
- Uncontrolled Stock "Count Variance" per outlet per accounting category: This is a bar chart of the former number, shown per outlet, per accounting category.
- Uncontrolled Stock (Count Variance) Value over Time: This shows the total variance for each inventory count during the selected period.
- Top 15 Items with Negative Net Uncontrolled Stock (Depletion).
- Top 15 Items with Positive Net Uncontrolled Stock (Addition).
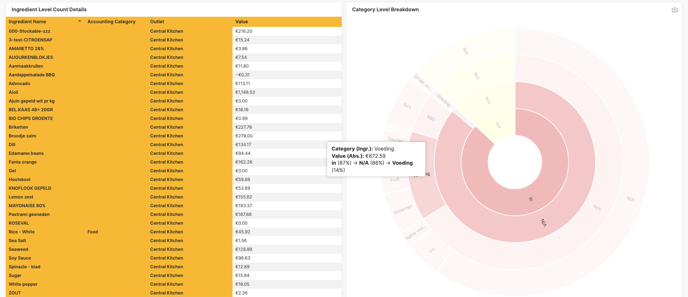
- Ingredient Level Count Details: This table shows for every package the counted value per outlet and accounting category.
- The Category Level Breakdown: Here you can check per Uncontrolled Stock In/Out ,and per category, the variance.
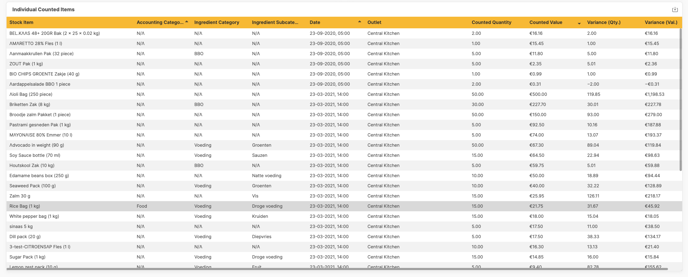
- Individual Counted Items: This shows for every Stock item the categories, the date on which it was counted, the outlet, the counted quantity, value, and the variance for each in detail.
As with all our dashboards, you can download each item of the dashboard by clicking this symbol: ![]() .
.