An initial condition is that the prices of your products are kept up to date when you receive orders in Apicbase. If your supplier is integrated with Apicbase this will of course happen automatically.
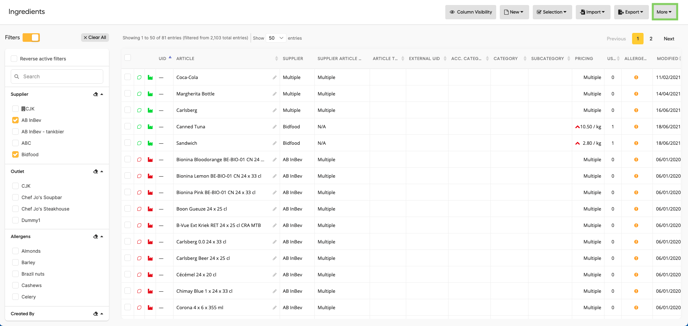
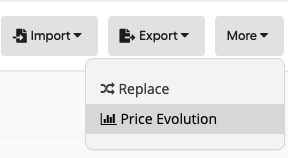
From your ingredient list, click 'More' in the top right of your screen. In that dropdown list, you can click the 'Price Evolution' button.
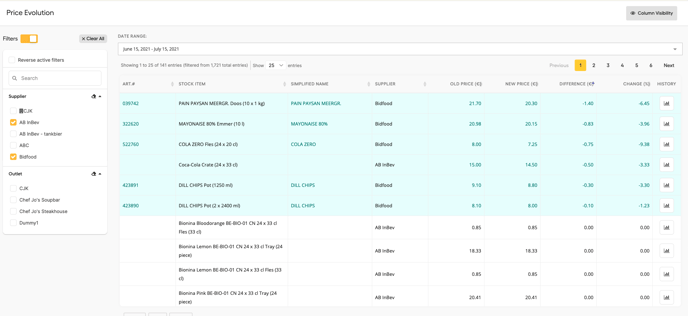
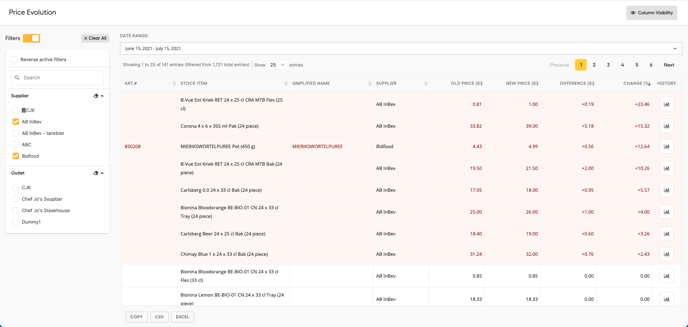
This will bring you to the following data table:
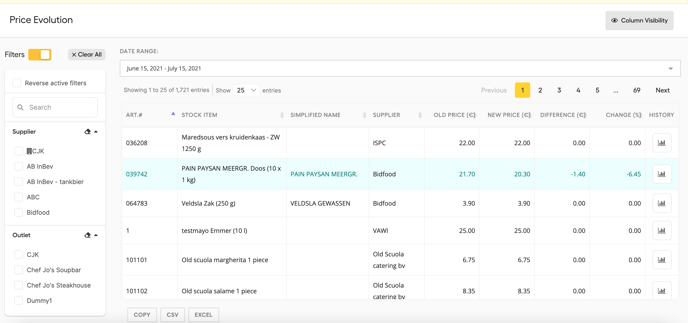
Under 'date range' you can change the period you want to analyse. The 'old price' is always the price from before the first day of this date range. In addition, we also show the name of the package, the supplier and, most importantly, the 'new price'. The difference between the old and new price is displayed, as well as the percentage change. Know that you can also sort each of these columns (descending or ascending). If you do this on the column where we show the percentage change, you will see at a glance which products have dropped in price and which products have become more expensive. This allows you to quickly make changes in your business.