- To go to the Inventory Snapshot Dashboard, click on "Dashboards" in the upper menu and click on "Inventory Snapshot Dashboard".
- Select the outlet for which you want to see the data.
- You can check the following key figures on your inventory for the selected outlet and period.
- Current Stock Value: The current value of your stock items.
- Current Negative Stock Value: The value of all items that currently have negative stock in your inventory.
- Current Stock Value per Outlet: This graph will show you the current value of your stock in all your outlets.
- Current Stock Value per Accounting Category: This graph shows you the current value of your inventory spread over the different accounting categories.
- Stock Value Distribution: This graph will show you all the items in your current inventory. The bigger they are, the more value they represent in your current inventory.
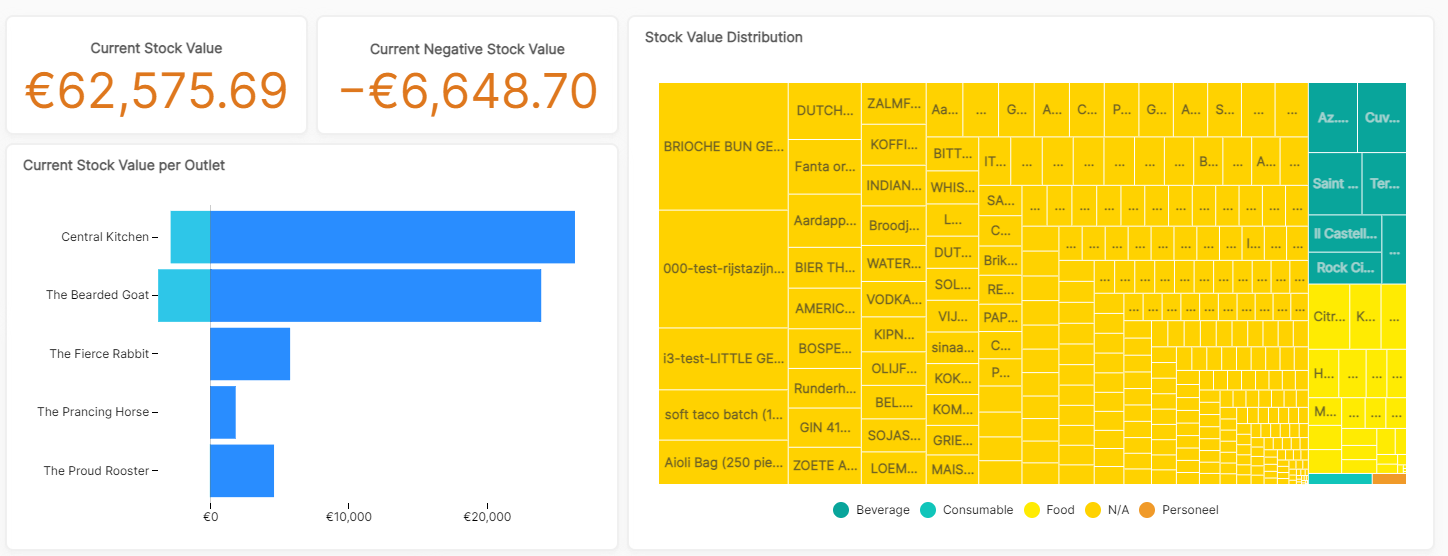
When you have over one of the bars or blocks in the graph, you get more details like the value, event, percentage...