This information you can find in the sales analytics module. Open the module and filter on the period you want to check the sales data.
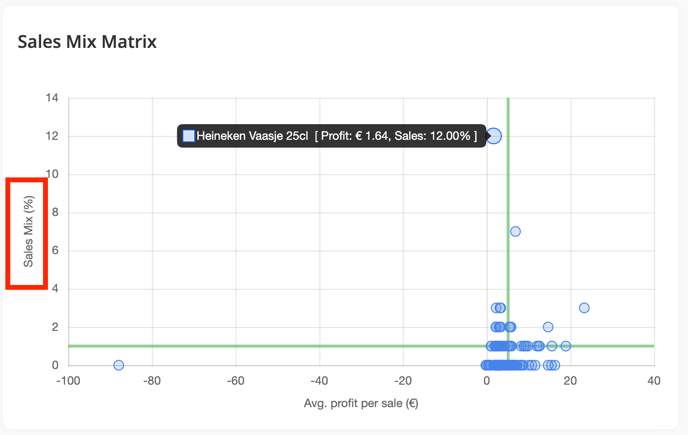
First in the graph you find an oversight of the % in the sales mix per item and the average sale per item. The Y-axis is the percentage of this item in my total sales mix. So 12% of my sales were "Heineken Vaasje 25cl". You can hover over each dot to check the specific item.
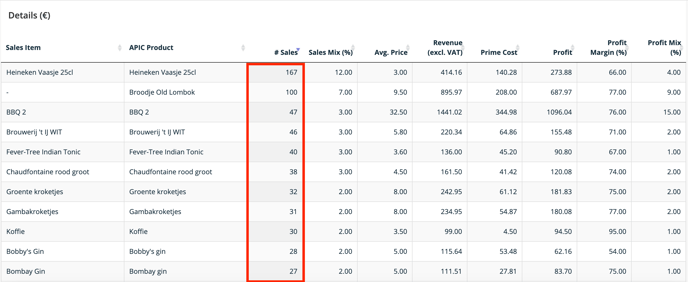
Next you can also check below the table with all the sales information. This table is filtered on most sold items by default. So you best sold items will be shown first. In this case, as we have seen in our graph, it is the "Heineken Vaasje 25cl" with 167 sales in the selected period.
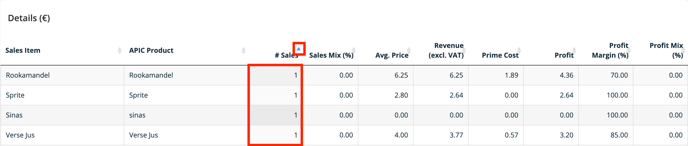
When you change the order by clicking the arrow next to the "# Sales" header, you get your lowest selling items.