Table of Contents
-
ESG Data at Ingredient level
2.1. What information can be added
2.2. How to add ESG data
2.3. CO₂ column in the Ingredient List -
Recipe ESG visualization
3.1. How ESG indicators are calculated
3.2. CO₂ column in the Recipe List -
ESG Dashboard
5.1. How it works
5.2. Sections overview
1. What is ESG and why it matters
ESG stands for Environmental, Social, and Governance — a framework that helps food businesses measure sustainability and ethical performance.
In Apicbase, the ESG module enables you to track and report environmental indicators, such as:
-
CO₂ equivalent emissions (CO₂eq/kg)
-
Water consumption
-
Land use
-
Protein source (plant/animal/mixed)
-
Country of origin
-
Food ecolabels (e.g., Bio, Fair Trade)
This functionality supports sustainability initiatives like the EU “Farm to Fork” strategy and Corporate Sustainability Reporting Directive (CSRD) requirements.
⚠️ Paid Feature: Footprint tracking is part of the premium ESG module.
Contact your Apicbase Sales Representative to enable it in your library.
2. ESG Data at Ingredient level
ESG indicators are stored at ingredient level, similar to nutritional values. Once added, they automatically flow through to recipes and dashboards.
2.1. What information can be added
| Indicator | Description |
|---|---|
| CO₂ equivalent (CO₂eq/kg) | Greenhouse gas emissions per kg of ingredient. |
| Water use (m³/kg) | Water consumption per kg of product. |
| Land use (m²/kg) | Land required to produce 1 kg of ingredient. |
| Protein source | One of: plant-based, animal-based, mixed, or unknown. |
| Country of origin | ISO country code or full name. |
| Food ecolabels | Optional multi-select list of ecolabels. |
💡 These fields are optional, but to calculate recipe-level CO₂ properly, all ingredients must have a CO₂/kg value. Otherwise, the calculation won't be accurate.
2.2. How to add ESG data
To ensure accurate tracking and sustainability insights, Apicbase allows you to add ESG indicators directly at the ingredient level. Whether you’re entering data manually, importing via Excel Import, or integrating with external partners, these values become the foundation for all downstream ESG reporting.
You can populate this data:
- Manually:
- Go to Ingredients › open the ingredient.
- Navigate to the Footprint tab and go into Edit mode by clicking 'Edit'.
- Enter values for CO₂eq/kg, water, land use, etc.
- Click Save.
If your ingredient is linked to an external data source (e.g. Klimato or PS in Food), values may appear automatically.
- Via Excel Import
-
Download the ingredient import file.
-
Fill in ESG columns (CO₂eq/kg, water, land use, protein source…).
-
Upload the file via Imports › Ingredients.
-
ESG columns are always present in the template — even if the ESG module is not yet active — so your data will be ready once the module is enabled.
Via API or partner integrations
Currently there are integrations with My Emissions and BrightGreen. The integration with Foodstep is in development, and there are more to come...
2.3. CO₂ column in the Ingredient List
After adding ESG data, a CO₂ column appears in the ingredient overview.
It provides a quick comparison of emissions per kg.
If color-coding is enabled, thresholds from your library settings define the color displayed.
(Insert screenshot of Ingredient list showing CO₂ column — ensure sensitive data blurred, per style guide.)
3. Recipe ESG visualization
3.1. How ESG indicators are calculated
Apicbase automatically calculates recipe-level CO₂ impact using ingredient data:
-
Each ingredient’s CO₂eq/kg × ingredient quantity (in kg)
-
Sum of all ingredients = total recipe CO₂eq
-
Divide by total recipe weight → CO₂eq/kg
⚠️ You cannot add ESG data directly to a recipe.
All values come from the ingredients’ ESG data
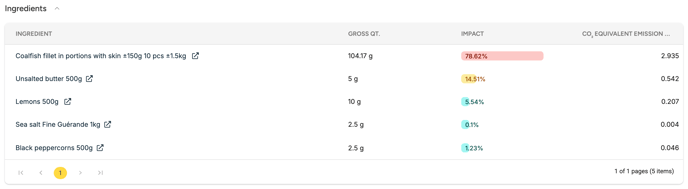
In the recipe footprint view, you can see which ingredients have the highest CO₂ contribution, visually represented with coloured bars.
3.2. CO₂ column in the Recipe List
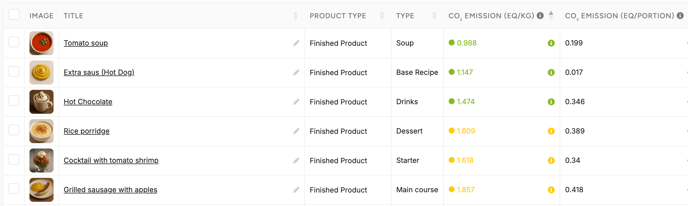
Your Recipe List includes a CO₂ column, showing emissions per kg for quick comparisons between recipes.
4. CO₂ scores and Color coding
How to set up CO₂ scores in Settings
To make footprint values more intuitive, Apicbase uses color codes to represent CO₂ levels.
You can customize the threshold values in:
Settings › Library › Footprint Thresholds
Default values (kg CO₂eq):
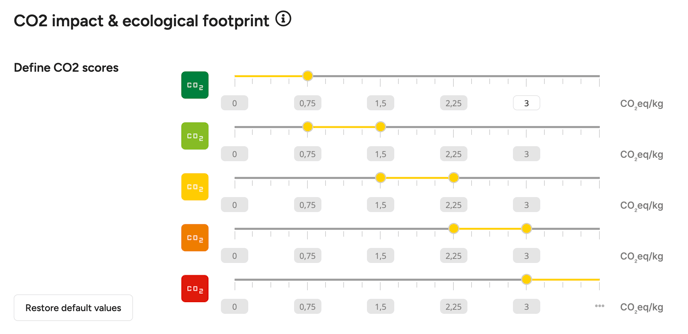
💡 Tip: The number in the top-right corner of the settings card lets you quickly change the scale of the threshold limits.
What the scores represent
Color codes are visual guidelines only, not official standards.
They help users interpret sustainability performance at a glance.
References are inspired by the French Carbone Score system (A–E scale)
5. ESG Dashboard
5.1. How it works
The ESG Dashboard aggregates data from Procurement.
It tracks how purchased items contribute to your overall environmental footprint.
⚠️ All metrics shown in the ESG Dashboard are calculated from Procurement data, not recipe data
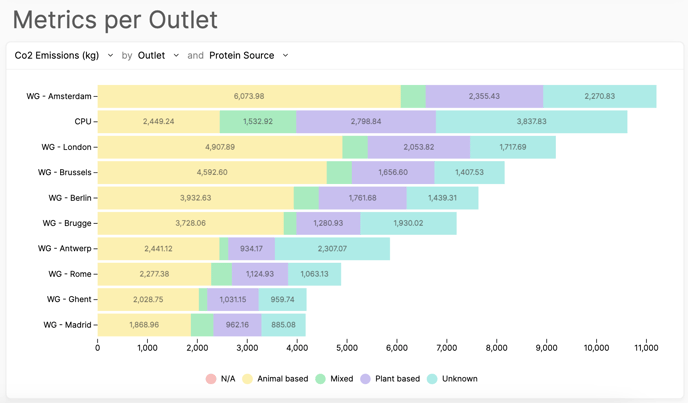
5.2. Sections overview
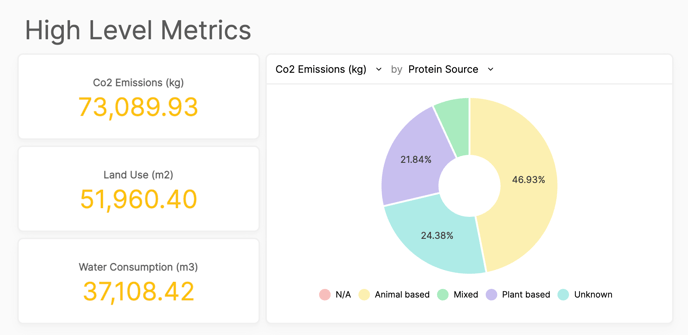
The dashboard includes several key visualizations:
-
Total CO₂ Impact over time
-
Coverage % — how many purchased items have ESG data
-
Average CO₂eq/kg of all purchases
-
Trends & Comparisons vs. previous periods
-
Procurement vs. Sales ratio to track efficiency
Each section provides actionable insights into your environmental performance.
Use it to benchmark outlets, monitor sustainability improvements, and prepare CSRD-compliant reports.
Summary
By activating the ESG Footprint module, you can:
-
Add CO₂ and other sustainability metrics to ingredients
-
View calculated recipe-level impacts
-
Use color coding to spot high-impact items
-
Track procurement-based emissions in the ESG Dashboard
Together, these tools give your team the data needed to make sustainable, transparent decisions in Apicbase.